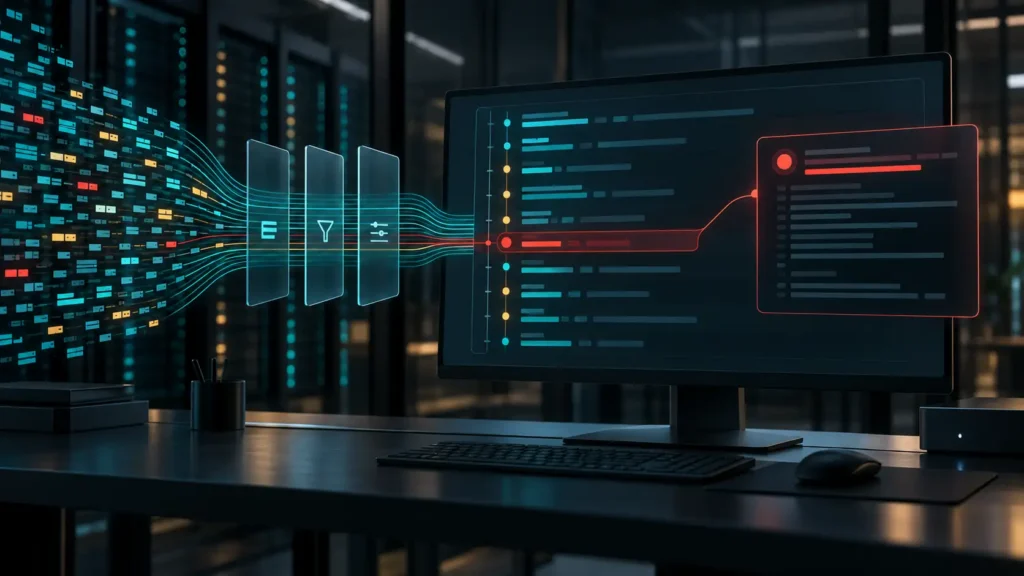
Linux logs often look harder than the problem they describe. A single boot can produce thousands of routine messages from the kernel, services, devices, and user sessions. Opening the entire stream and searching at random usually creates more noise, not more understanding.
On most current distributions that use systemd, journalctl provides a better approach. It reads the systemd journal, where events carry structured metadata such as a timestamp, boot ID, service unit, process ID, and priority. That structure lets you reduce a machine-wide history to a small, relevant sequence: the affected boot, the failing service, the minutes around the failure, and the severities worth inspecting.
This guide develops that filtering habit from the ground up. Every command only reads the journal. You will learn how to establish scope, follow a service safely, interpret context, and export useful evidence without pasting an entire system history into a support ticket.
- What the systemd journal records
- How to narrow logs by boot, service, and time
- How priorities and text searches differ
- How to follow a problem live
- A repeatable troubleshooting runbook
- How to export and share logs responsibly
Understand what journalctl is reading
The systemd journal collects messages from multiple sources, including services, the kernel, standard output and error streams, and the traditional syslog interface. According to the upstream journalctl documentation, running the command without options prints every accessible entry, starting with the oldest. That is valid, but rarely useful for diagnosis.
Unlike a plain text file, each journal entry can contain structured fields. The systemd journal field reference documents familiar fields such as MESSAGE and PRIORITY, plus trusted metadata added by the journal, including _PID, _UID, _BOOT_ID, and _SYSTEMD_UNIT. Commands such as -b and -u are convenient ways to query that metadata.
Access depends on the distribution and local policy. Root can normally read the complete system journal, while members of groups such as systemd-journal, adm, or wheel may receive broader access. Start without sudo; add it only when a relevant service’s messages are missing or the command reports insufficient permission. Permanent group changes are administrative decisions, not a troubleshooting shortcut.
The journal’s history can also differ between machines. The journald.conf reference explains that storage may be volatile under /run/log/journal or persistent under /var/log/journal, depending on configuration and available directories. The distinction is easier to place after reviewing the Linux filesystem hierarchy. If an older boot is absent, it may never have been retained.
If shell navigation and command syntax still feel unfamiliar, review the essential Linux terminal commands first. journalctl is most effective when pipes, quoting, and elevated permissions are already understood.
Start with boot, service, and time
Before reading individual messages, define the event you are investigating. Ask three questions: Did it happen during the current or an earlier boot? Which service or subsystem was involved? Approximately when did the symptom begin?
List the boots retained in the journal:
journalctl --list-boots
The current boot is 0; earlier boots use negative offsets. Show messages from the current boot with:
journalctl -b
For the previous boot, which is especially useful after a crash or failed shutdown, use:
journalctl -b -1
Next, select the relevant systemd unit. For example:
journalctl -u ssh.service --since "today"
Unit names vary. Some distributions use ssh.service, while others use sshd.service. Confirm the actual name with systemctl status or systemctl list-units --type=service instead of assuming. The same pattern works for a web server, database, backup timer, or custom application service.
Time filters are often the biggest reduction in noise. Relative expressions are convenient for an active incident:
journalctl -u nginx.service --since "-30 min"
For a known window, specify both boundaries and use an unambiguous output timestamp:
journalctl -u example.service \
  --since "2026-10-19 09:00:00" \
  --until "2026-10-19 09:15:00" \
  -o short-iso
Use the machine’s local clock when constructing the window, and widen it by several minutes if client and server clocks may differ. A failure message often appears after the warning that explains it.
Filter severity without losing the cause
Journal priorities follow the syslog scale, from emerg at the most severe end through debug at the least severe. A useful first pass for the current boot is:
journalctl -p warning..alert -b
The range is explicit: it includes warning, error, critical, alert, and more severe messages, but excludes informational and debug entries. A single upper threshold such as -p err also includes priorities more severe than error; it does not mean “only entries labeled error.”
Severity is a filter, not a verdict. Linux systems can operate normally while recording warnings about optional hardware, expected authentication failures, or a service that deliberately retried. Conversely, the decisive clue may be an informational line immediately before the error. Once you find a suspicious timestamp, rerun the query with a wider priority range or without -p to restore context.
For a known word or pattern, -g searches the MESSAGE field with a regular expression:
journalctl -g 'timeout|failed'
This is useful when you know the vocabulary of the symptom, but it should not replace unit and time filters. Applications describe similar failures differently, and a text search can miss the initiating event.
Kernel and device problems have their own convenient view:
journalctl -k -b
Use it for driver initialization, storage errors, network interfaces, out-of-memory events, or hardware detection during the current boot. Pair it with --since or -p when the output is still too broad.
Follow a service without drowning in output
When a problem is reproducible, start with recent context and then follow new entries:
journalctl -u example.service -n 100 -f
The -n 100 option prints the latest 100 matching entries, while -f keeps the command attached as new messages arrive. In another terminal, reproduce the action once. Stop following with Ctrl+C; that ends the viewer, not the service.
This two-terminal workflow is particularly useful over SSH. If you are diagnosing another machine, establish secure access first, then keep one session dedicated to logs and the other to the controlled reproduction.
Avoid following the entire journal on a busy host. Background services can push the line that matters off screen in seconds. Scope by unit, boot, and time first. If a service has several related units, run separate queries or add more than one -u option rather than removing the filter entirely.
The final error often reports the consequence, not the cause. After locating it, inspect the preceding entries from the same unit and time window for configuration warnings, permission denials, failed dependencies, resource limits, or connection timeouts.
Use a repeatable troubleshooting runbook
Random commands are difficult to reproduce and easy to overinterpret. A short runbook keeps the investigation grounded in evidence:
- Describe the symptom precisely. Record what failed, when it happened, and whether it affects one user, one service, or the whole machine.
- Confirm the unit and its current state. Run
systemctl status example.serviceto obtain the exact unit name, recent messages, and whether systemd considers it active or failed. - Select the boot. Use
journalctl --list-boots, then choose-bor an earlier offset. Do not mix evidence from separate boots accidentally. - Limit the time window. Begin a few minutes before the symptom and end after the last relevant action.
- Filter by unit or kernel. Use
-ufor a service and-kfor kernel-level hardware or driver events. - Apply priority or text filters only as needed. Start narrow, then restore surrounding messages once a clue appears.
- Form one hypothesis. A permission denial suggests checking ownership and access; a timeout suggests checking the remote endpoint and network path. Do not change several unrelated settings at once.
- Make one reversible correction, reproduce once, and compare. Fresh logs should show whether behavior changed.
The log provides evidence, not automatic remediation. Copying a command from an unrelated forum thread because one error word matches can turn a small service problem into a system-wide configuration problem. Verify the component, distribution, and documented rollback before changing anything.
Export only the evidence you need
For a stable excerpt that does not open an interactive pager, run a bounded query such as:
journalctl -u example.service \
  --since "2026-10-19 09:00:00" \
  --until "2026-10-19 09:15:00" \
  -o short-iso --no-pager
Redirect it to a file only after confirming the scope:
journalctl -u example.service --since "-15 min" \
  -o short-iso --no-pager > example-service.log
Review the file before sharing it. Logs may reveal usernames, hostnames, internal IP addresses, email addresses, filesystem paths, command lines, URLs, device identifiers, and occasionally secrets passed incorrectly as command arguments or environment data. Remove sensitive values while preserving timestamps, severity, unit names, and enough adjacent lines to show sequence.
For a support case, prefer raw, scoped output over a huge journalctl -xe dump. The -x option adds explanatory catalog text where available, which can be helpful locally but may add material that is not part of the original event. A narrow query with its command, time zone, distribution version, affected package version, and reproduction steps is usually more actionable.
Conclusion
Reading Linux logs is not about memorizing every message. It is about shrinking the search space in a consistent order: select the boot, choose the service or kernel, bound the time, filter severity carefully, and then restore enough context to understand the first failure.
journalctl makes that workflow possible because the journal is structured rather than merely a long text stream. Begin with a precise question, use the least privilege needed to read the answer, and share only a reviewed excerpt. The result is a troubleshooting record that is faster to interpret, safer to disclose, and far more useful than an unfiltered wall of logs.