A Windows crash rarely arrives with a complete explanation. An application closes, the PC restarts unexpectedly, or a device stops responding—and by the time the desktop returns, the useful sequence of events has disappeared from view.
Reliability Monitor turns part of that history into a readable timeline. It places application failures, Windows failures, hardware-related reports, warnings, and successful software changes on the dates when Windows recorded them. Instead of beginning with thousands of Event Viewer entries, you can start with a day, select the event that matches the symptom, and inspect the technical details behind it.
That convenience needs discipline. A red failure marker is evidence that something happened, not proof that the component named on the screen caused the underlying problem. An update installed before a crash is a correlation, not automatically the culprit. This guide shows how to extract useful evidence, recognize recurring patterns, and choose the next diagnostic step without treating the stability graph as a verdict.
- What Reliability Monitor records
- How to open and navigate reliability history
- How to interpret the stability index
- How to read an individual failure
- How to correlate failures with system changes
- What to do after finding a pattern
What Reliability Monitor is—and what it is not
Reliability Monitor is a historical view of stability-related events. It is part of the Windows performance tooling, and Microsoft documents the perfmon /rel option as the command that starts Reliability Monitor. The visual timeline is designed to make failures and important changes easier to compare over days or weeks.
Underneath that view, Windows exposes reliability data through its Reliability WMI provider. Microsoft’s Win32_ReliabilityRecords reference says the records contain information from the Windows Event Log related to system reliability. Fields can include the event identifier, source, product name, message, log, user, and generation time.
Reliability Monitor is therefore useful for questions such as:
- Did the same application fail repeatedly or only once?
- Did crashes begin after a driver, Windows update, or application installation?
- Did Windows record a hardware error near an unexpected restart?
- Is the failure recurring at a particular time or workload?
It is not a real-time resource monitor, a hardware benchmark, a malware scanner, or a complete replacement for Event Viewer and crash-dump analysis. For current CPU, memory, disk, or network pressure, use Task Manager or Resource Monitor. On macOS, the comparable real-time workflow is described in the guide to using Activity Monitor on Mac; that is a different job from reviewing Windows stability history.
Open the history and orient yourself
The most direct launch method works on current Windows client systems:
- Press Windows + R.
- Enter
perfmon /rel. - Press Enter.
You can also search for View reliability history from Windows Search. The exact Control Panel path may vary by Windows version, so the command is easier to document and repeat.
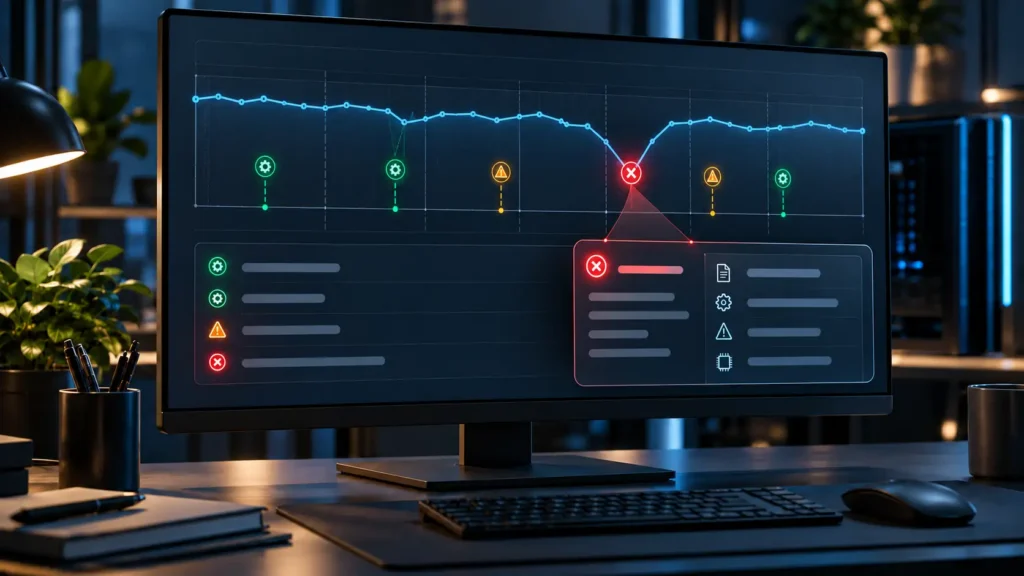
The upper section presents the stability trend and event markers by day or week. Select a date to populate the lower section with the events recorded for that period. Typical rows distinguish application failures, Windows failures, miscellaneous or hardware-related failures, warnings, and informational events such as successful installations.
Begin with the date and approximate time of the symptom. If the computer restarted at 15:20, a failure at 09:00 is probably unrelated. Select the event closest to the observed behavior and open its technical details. Then look one or two days backward for changes, rather than assuming every marker on the selected day belongs to the same incident.
New Windows installations may not have enough history to show a meaningful trend immediately. A blank or sparse graph is not proof that monitoring is broken. It can simply mean the system has not accumulated enough reliability data yet, or that policy and service configuration limit collection.
Treat the stability index as a trend
The blue line summarizes system stability over time. Microsoft’s Win32_ReliabilityStabilityMetrics documentation defines the System Stability Index as a value from 1, least stable, to 10, most stable. It is calculated from recorded reliability metrics.
The useful information is the direction and timing, not a universal passing score. A sharp decline identifies a period worth investigating. A gradual recovery indicates that recent measurement periods contained fewer stability-reducing events. Two computers with different workloads should not be ranked simply by comparing today’s number.
Do not optimize the score for its own sake. A single program that crashes repeatedly can pull down the trend even if the rest of the machine is dependable. Conversely, a high index does not certify hardware health, security, data integrity, or application correctness. It only summarizes the reliability events Windows collected.
The graph becomes actionable when you can state the pattern precisely: “The index began falling on November 2, and the same graphics application failed on three consecutive days after version 8.4 was installed.” That statement can be tested. “My score is 6.8, so the PC is bad” cannot.
Record what failed, its approximate time, and what you were doing. Starting with the symptom reduces confirmation bias: you search for the matching evidence instead of inventing a problem for every red marker.
Read the event details, not just the icon
Select an event and open View technical details. The fields vary by report type, but application failures commonly identify the application name and version, faulting module, exception code, and report identifier. Windows or hardware-related entries may expose a problem-event name and a set of signature values.
These details support several levels of confidence:
- Event identity: the application or Windows component associated with the report.
- Repeatability: whether the same event name, module, code, or signature appears again.
- Timing: whether the report coincides with the symptom the user observed.
- Change context: whether an update, driver, or installation occurred shortly before the pattern began.
Microsoft describes Windows Error Reporting as infrastructure for application faults, kernel faults, unresponsive applications, and application-specific problems. Its reports can help Windows and software developers classify failures. The presence of a report is therefore useful evidence, but a faulting module name is not always the root cause. It may be where the failure surfaced after corruption, a bad input, a plug-in problem, a driver fault, or an earlier resource failure.
Copy the exact application, module, event name, version, and code before searching documentation or contacting support. Generic descriptions such as “Windows stopped working” lose the identifiers that distinguish one failure family from another.
Correlate changes without blaming them automatically
Reliability Monitor is strongest when it places failures beside successful changes. Suppose an application begins crashing on the same date as an update. That creates a reasonable hypothesis, but three checks are still necessary:
- Did the failures occur before the update as well?
- Does the crash recur when you repeat the same action?
- Does the problem stop after a supported rollback, repair, or clean reinstall?
Use the timeline to form one hypothesis, then change one variable. Rolling back a driver, disabling one optional extension, or repairing one application is testable. Uninstalling several updates, deleting system files, cleaning the registry, and changing firmware settings at once destroys the comparison and increases risk.
Installation events also clarify expected failures. If a disposable test application crashes inside your main Windows installation, Reliability Monitor may record it even though the rest of the OS is healthy. For future evaluations, a restricted Windows Sandbox environment can keep routine software testing separate from the host while preserving realistic limits about what a sandbox can protect.
Repeated timing can reveal another kind of relationship. A failure every morning may align with a scheduled updater or backup. A graphics error only during games points toward a load-dependent path. An unexpected shutdown followed immediately by “Windows was not properly shut down” records the consequence; it does not by itself explain whether power, firmware, hardware, or a forced reset caused it.
Use a repeatable investigation workflow
For a crash or restart that has already happened, use this sequence:
- Record the observed symptom and time. Include the application, action, and whether the PC froze, restarted, or returned to the desktop.
- Open
perfmon /rel. Select the matching day and the event nearest the timestamp. - Capture the technical identifiers. Note the source, product, version, event name, module, code, and report ID that are present.
- Look for repetition. Check earlier days for the same identifiers rather than counting every red icon as the same problem.
- Review nearby changes. Identify application, driver, and Windows installations preceding the first occurrence.
- Create one falsifiable hypothesis. For example: “The crash began after this graphics-driver version and occurs only under 3D load.”
- Apply the least disruptive supported test. Update or roll back one component, remove one optional plug-in, or reproduce in a clean application profile.
- Return to the timeline. Confirm whether the same event reappears after the test.
Preserve evidence before performing a reset, clean installation, or broad cleanup. A screenshot of the selected date and a text copy of the technical details can help support teams, but review them before posting publicly. Reports may contain usernames, local paths, package names, versions, device details, and report identifiers.
Choose the next tool based on the event
Reliability Monitor narrows the branch of the investigation; it rarely finishes the diagnosis alone.
For an application crash, update the application, test without plug-ins, check the publisher’s release notes, and provide the exact faulting module and exception code to support. If the failure is reproducible and higher-level troubleshooting is exhausted, a developer may need a Windows Error Reporting dump.
For a blue screen or kernel-related report, record the stop information and preserve dump files before cleanup. Driver versions, firmware, temperatures, storage health, and memory testing may become relevant, but do not infer a failed physical component from the phrase “hardware error” alone.
For an unexpected shutdown, determine whether Windows recorded a controlled restart, a bugcheck, or only evidence that the previous session ended improperly. Check power delivery and firmware only when the symptoms justify those branches.
For a warning or failed update, use the event’s exact product and code with Microsoft’s or the vendor’s current documentation. Avoid generic “repair everything” command lists. A failed optional update and a recurring application crash are different incidents even if they share a date.
If Reliability Monitor shows no matching event, move to Event Viewer, application logs, Task Manager, Resource Monitor, or vendor diagnostics according to the symptom. Absence from this curated history does not mean the event never occurred.
Conclusion
Windows Reliability Monitor makes past instability approachable by organizing failures and changes on a common timeline. Its stability index highlights when reliability changed, while event details provide the names, versions, codes, and report identifiers needed for a focused investigation.
Its best use is correlation with restraint. Start from a real symptom and timestamp, find the matching event, check whether it repeats, review nearby changes, and test one hypothesis at a time. The graph does not hand down a root cause—but it can turn an unexplained crash into a precise question that the next diagnostic tool can answer.