For a while, I made the same mistake with monitoring that I have made with other homelab tools: I assumed the more powerful answer must also be the more appropriate one.
If I wanted visibility, I thought about Prometheus.
If I wanted dashboards, I thought about Grafana.
If I wanted to be serious, I thought in terms of metrics, panels, retention, exporters, and trends.
All of that has its place. I mean that sincerely. A proper metrics stack changes the way you understand a system over time, and I wrote about that more directly in Proxmox host monitoring.
But there is another kind of question that comes up all the time in a homelab:
"Is the thing up right now?"
That question does not always need a graph first.
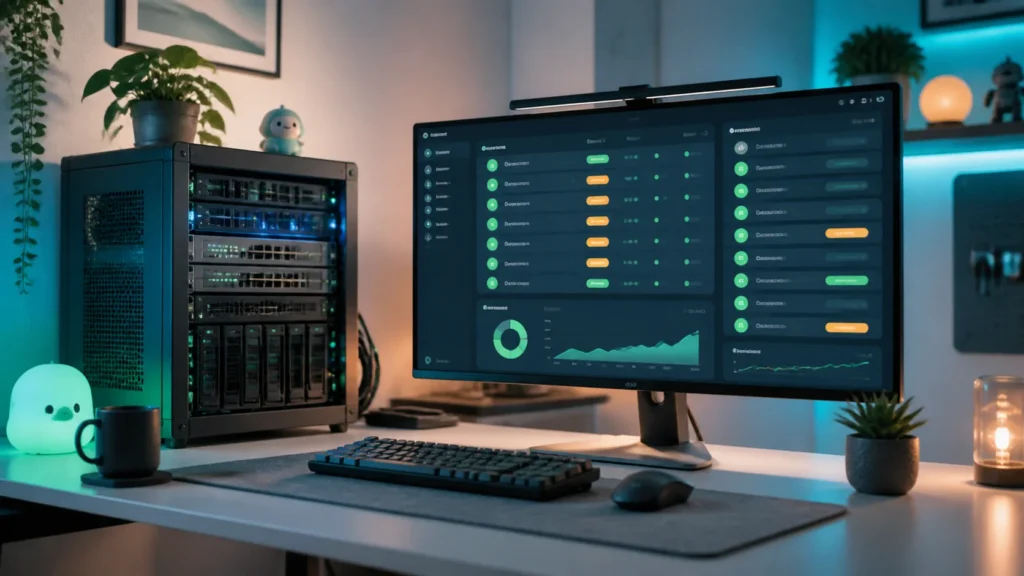
Sometimes I do not want a time series. I want a clean service list, a few sensible checks, a quiet alert when something obvious breaks, and a status view I can trust in ten seconds. That is the gap Uptime Kuma filled for me. It made monitoring feel smaller, faster, and more human.
- Why Uptime Kuma solved a different monitoring problem for me
- What it is actually good at in a homelab
- How I would install it cleanly the first time
- Which checks I would create first
- How I think about notifications without creating noise
- Why the built-in status page matters more than it sounds
- What I would avoid when exposing it later
For the technical baseline below, I use the project's official repository and separate documented platform behavior from my own placement and operating recommendations.
Uptime Kuma clicked when I stopped asking it to be Prometheus
This was the mindset shift.
Uptime Kuma is not the tool I reach for when I want deep historical resource analysis. It is the tool I reach for when I want immediate operational truth. The official project README describes it as an easy-to-use self-hosted monitoring tool, and that wording is important. Its strength is not maximal complexity. Its strength is fast clarity.
The README lists a surprisingly broad set of monitor types, including HTTP, TCP, keyword checks, JSON query checks, WebSocket, ping, DNS record checks, push monitors, and even Docker container monitoring. It also supports certificates, status pages, and a large range of notification providers.
That is a lot of range for something that still feels approachable.
What made it useful to me emotionally was that it shrank monitoring back down to the size of ordinary questions:
- is the homepage responding;
- is the reverse proxy actually reachable;
- is DNS resolving what it should resolve;
- is a critical TCP port open;
- did a certificate quietly drift toward expiry;
- is a backup or application service alive at all.
Those questions come earlier than dashboards full of host metrics. In many cases, they also matter sooner.
This is the monitoring tool I want when I care about services first
Metrics tell you how a system behaves.
Uptime checks tell you whether a service is reachable.
Those are related, but they are not the same thing.
That distinction is exactly why I think Uptime Kuma belongs beside a broader observability stack rather than beneath it. Prometheus and Grafana help answer "why is this host acting differently?" Uptime Kuma helps answer "did the service disappear?" One is about patterns and depth. The other is about operational certainty.
In a homelab, that certainty matters more than many people admit. A self-hosted environment often includes only a handful of genuinely important services, but those few services become woven into everyday habits very quickly. Password managers, reverse proxies, media stacks, dashboards, VPN endpoints, backup targets, or documentation sites all have a way of becoming normal until the moment they are not there.
That is when a simple uptime board becomes more useful than a beautiful metrics wall.
I would install it in Docker first unless I had a strong reason not to
The official project documents both Docker and non-Docker installation paths. The non-Docker route is completely legitimate, but it expects Node.js, Git, and PM2. In a normal homelab, I would still choose Docker first because it keeps the setup small and easy to move.
The official README and installation wiki both show Docker and Docker Compose approaches. The Compose route is the one I would recommend first because it makes the service feel easier to maintain later.
I would start with something this simple:
services:
  uptime-kuma:
    image: louislam/uptime-kuma:2
    container_name: uptime-kuma
    restart: unless-stopped
    ports:
      - "3001:3001"
    volumes:
      - uptime-kuma:/app/data

volumes:
  uptime-kuma:
Then bring it up with:
docker compose up -d
At that point, the interface is usually reachable on:
http://your-ip:3001
or http://localhost:3001 if you are opening it locally on the host.
One warning from the official documentation is worth taking seriously: file systems like NFS are not supported for the application data path because file locking matters here. That warning is easy to gloss over, but I would not. Uptime Kuma uses SQLite for its local data, and this is exactly the kind of detail that feels harmless until it becomes a recovery story later. I would keep /app/data on local storage or a proper local Docker volume from day one.
My first deployment would stay private and slightly boring
I would not expose Uptime Kuma publicly at the beginning unless I had a good reason.
In an internal-first homelab, I like starting it the same way I like starting many other tools:
- accessible on the local network;
- fronted by nothing at first if I am only validating behavior;
- moved behind a reverse proxy later if I want a cleaner URL;
- kept off the internet unless there is a very clear reason to expose it.
That matters because monitoring tools can become sensitive little maps of your environment. They reveal hostnames, service names, paths, and sometimes timing patterns you do not really need to share.
So the first version I trust is the simple one: private, local, functional.
The best first monitors are the ones you would notice missing fastest
This is where I think people can either make Uptime Kuma feel immediately useful or accidentally turn it into dashboard furniture.
I would not begin by monitoring everything I own.
I would begin by monitoring what would actually interrupt me.
For a small homelab, that often means checks like:
- the public-facing or reverse-proxied home page;
- the main gateway or firewall IP with a ping check;
- the DNS resolver or DNS-over-HTTPS endpoint you rely on;
- the Proxmox web interface;
- a key self-hosted application such as a password manager or documentation site;
- the backup target or API endpoint you depend on most.
The beauty of Uptime Kuma is that these checks can stay simple.
An HTTP monitor tells you whether a site responds.
A keyword or JSON query monitor can validate that a response contains something meaningful.
A TCP monitor can confirm that a service is listening.
A ping monitor can reveal network-level absence quickly.
A DNS record monitor can validate whether a record still resolves the way you expect.
That range is what makes the tool feel practical instead of toy-like.
I like to separate "service alive" from "host healthy"
This is another reason Uptime Kuma fits well beside other monitoring layers instead of replacing them.
A service can be alive while the host is slowly becoming unhealthy.
A host can also be healthy while the service itself is broken.
That is why I think the best homelab monitoring stack often has at least two different kinds of truth:
- uptime truth;
- resource truth.
Uptime Kuma handles the first one beautifully. Prometheus-style monitoring handles the second much better. Together, they feel far more complete than either one alone.
That is the same reason I still care about deeper hardware visibility, especially on Proxmox nodes, where thermals and fan behavior can matter long before a service disappears entirely. That layer deserves its own attention, which is why I still keep hardware sensor monitoring in a different category from simple uptime checks.
Notifications are where good monitoring can turn into bad monitoring
The official Uptime Kuma notification documentation makes it clear that the project supports a large number of notification methods, including built-in integrations and a much wider list through Apprise-backed services.
That is powerful, but it creates the usual risk:
if everything can notify you, everything eventually will.
The first alerting mistake is not technical. It is emotional.
People build alerts as if more channels automatically equal more awareness. In practice, noisy alerts mostly teach you to stop caring. So the first notification setup I trust is the one that stays deliberately narrow.
I would begin with one or two notification paths only:
- one real-time path, such as Telegram, Gotify, or Discord;
- one quiet fallback path, such as email.
Then I would assign notifications only to monitors I genuinely care about, not every low-stakes service in the environment. A homelab alert should mean something. If a temporary dashboard or test app goes down, I do not necessarily need my phone to become dramatic about it.
Useful alerting is less about proving that every failure was detected and more about making sure the detections that matter still feel trustworthy.
The status page sounds like a cosmetic feature until you actually use it
I underestimated this part.
The official wiki includes support for status pages and mapping them to specific domains. At first, that sounded like a public-facing nice-to-have. What I learned instead is that a status page is also useful internally. It gives your homelab a single place where service state is visible without signing into five different admin panels.
That is not cosmetic. That is operational clarity.
A good status page becomes a lightweight front door for understanding the environment:
- which services are up;
- which ones are degraded;
- what has had recent incidents;
- what is intentionally private but still worth checking from one page.
If you later decide to expose a status page externally, the official documentation notes that domain mapping and reverse proxy handling need to be configured correctly so Uptime Kuma knows the proper host information. That is the kind of feature I would add second, not first.
If you reverse proxy it later, respect the WebSocket requirement
This is one of those small implementation details that deserves to be remembered.
The official reverse proxy wiki notes that Uptime Kuma is WebSocket-based and that reverse proxies need the proper Upgrade and Connection headers. That is the kind of thing that can make an otherwise correct-looking proxy setup behave strangely enough to waste an hour.
So if I move Uptime Kuma from a plain internal port to a cleaner internal domain later, I would do it carefully:
- verify the base app locally first;
- add the reverse proxy only after the local instance is stable;
- make sure WebSocket headers are handled correctly;
- only then think about nicer routing or a public status endpoint.
That order keeps the troubleshooting path clean.
Conclusion
Uptime Kuma became useful to me the moment I stopped asking it to be a full observability platform and let it be what it already does very well: simple, readable service monitoring with fast feedback and low emotional overhead.
That matters more than it sounds.
In a homelab, many failures begin as very small questions. Did the app stop responding? Did the proxy path fail? Did DNS drift? Did a certificate expire quietly? Did the service disappear while the host itself still looked fine?
Those are Uptime Kuma questions.
Keeping that scope explicit also avoids the early homelab mistake of giving one tool too many responsibilities.
And once you have one page that answers them honestly, the whole environment starts to feel calmer.