Sometimes a Linux machine does not feel broken.
It just feels wrong.
The fan is louder than usual.
A terminal command returns more slowly than it should.
The desktop feels sticky.
A remote server suddenly seems busier than your mental picture of it.
That is the moment when htop starts being useful.
Not because it magically fixes anything, but because it turns vague discomfort into something you can actually look at.
- Why htop is easier to trust than raw process listings
- How I read CPU, memory, and process activity first
- The htop actions that matter most in real life
- Why tree view, sorting, and filtering change everything
- How I use htop safely when I only want visibility
Htop is not just prettier than top; it is more legible
The official htop project describes it as a cross-platform interactive process viewer. The upstream README and the manual page both emphasize the same core difference from top: you can scroll vertically and horizontally, see full command lines, work with a tree view, filter and sort interactively, and act on processes without having to type their PIDs first.
That is a bigger deal than it sounds.
What made htop click for me was not the color. It was the feeling that I could stay oriented while exploring. A lot of beginner friction with monitoring tools comes from losing context. You see a PID, then a percentage, then a process name you half recognize, and suddenly you are not sure whether you are observing the system or just staring at it.
htop reduces that feeling.
It gives you:
- visible system meters;
- a navigable process list;
- full command-line visibility when the window is wide enough or you scroll;
- direct process actions when you truly need them.
That combination makes it easier to move from “something seems off” to “this specific process family is consuming CPU” or “memory pressure is building because this workload keeps expanding.”
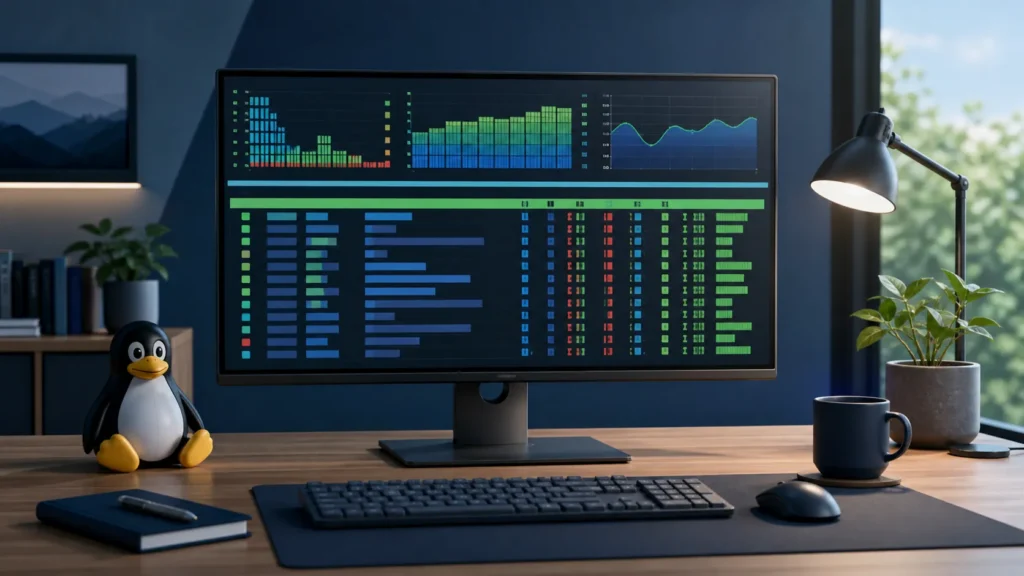
The first useful habit is to read the top of the screen before the process list
When I open htop, I try not to jump directly into hunting a process name. I read the general meters first.
The project README explains that htop shows system-wide information such as load average or swap usage alongside the process list. The man page also describes graph meters and a configurable display.
That means the screen is already answering the first question you should ask:
“Is this a system-wide problem or a single-process problem?”
If CPU meters are slammed across cores, that feels different from one core being pinned. If memory and swap are both under pressure, that tells a different story from a machine with plenty of free RAM but one runaway process. If load average is high while the visible CPU picture looks calmer than expected, that can push you toward looking deeper rather than assuming the first bright number explains everything.
I think beginners improve faster when they stop treating the process table as the beginning of the story. The top meters are the weather. The process list is the map.
The most useful htop actions are the boring ones you repeat constantly
The upstream README gives a wonderfully practical quick-start list:
- search processes with
/ - filter processes with
\ - toggle tree view with
t - change the sort column with
. - kill a process with
k
That is already most of what a beginner needs.
I would add one emotional rule: ignore the dramatic actions until the discovery actions feel natural.
Search and filter are where htop starts saving real time.
If I suspect a browser, container, language runtime, database, or sync tool, I do not want to visually scan a long process list while the machine is busy. I want to narrow the list quickly and confirm whether my suspicion matches reality.
This is where htop feels humane.
You are not being asked to memorize everything. You are being given a smaller list to look at.
Tree view is one of the most important features once the process list gets messy
The htop manual page says tree view shows processes in a hierarchy, and the README also highlights it as a first-class action.
I think tree view is one of the most underappreciated ways to understand what the machine is actually doing.
Without tree view, a busy application can look like a pile of unrelated entries:
- a parent launcher;
- worker processes;
- child helpers;
- shells or wrappers around the real workload.
With tree view, the machine starts explaining itself more honestly.
That matters especially on systems running:
- browsers with many subprocesses;
- container stacks;
- developer tools spawning background workers;
- services launched through wrappers or scripts.
If the system feels crowded, t is often the moment when the screen becomes readable again.
And because the manual page notes that sorting in tree mode applies to the direct children of each process, it is also a good reminder that tree view is about structure first, not just ranking everything by one global number.
Sorting and filtering are what turn htop from “interesting” into “useful”
The command-line options in the manual page also reinforce this design. You can launch htop with:
-For--filterto filter by fixed-string command terms;-sor--sort-keyto define a sort column;-pto show only certain PIDs;-uto show processes for a specific user;-tto start directly in tree view.
That means htop is not only interactive after launch. It can also be started with a point of view.
I like this because it changes how you think about the tool. Instead of always opening the full system and then wandering through it, you can open a narrower slice of reality on purpose.
For example, if I only care about one user’s processes, that is already a calmer screen. If I care about one service family, filtering right away keeps me from mistaking noise for relevance.
This is also why htop becomes such a good companion to SSH sessions. A terminal monitor that can be focused quickly is much more valuable than a “full picture” that takes too long to interpret under pressure.
--readonly is one of the most underrated ways to make htop safer
One of my favorite details in the current manual page is the --readonly option. It disables system- and process-changing features.
I really like that this exists.
Because sometimes you want visibility without temptation.
If I am on a machine where I only want to observe, document, or confirm a pattern, a read-only launch feels cleaner:
htop --readonly
That mode fits a very mature mindset:
- I am here to inspect;
- I am not here to renice or kill anything by accident;
- I want the tool to help me stay disciplined.
For beginners especially, this is a great habit on important systems. The best monitoring session is often the one where you learn something precise before you touch the workload at all.
Monitoring gets easier when you ask better questions
I think htop becomes dramatically more valuable once you stop asking:
- “What is wrong?”
and start asking:
- “Is this CPU pressure, memory pressure, or just one noisy process?”
- “Is this one program, or a parent process with many children?”
- “Is the problem global, or only tied to one user?”
- “Do I need the full system view, or should I filter down immediately?”
The tool supports that kind of thinking very well.
Its strength is not that it replaces every other monitoring utility. Its strength is that it gives you a fast, interactive first answer. It helps you characterize the problem before you decide whether you need logs, I/O tools, container tooling, or something deeper.
That is exactly why I keep coming back to it.
Verification note: Commands, terminology, and support details in this guide were cross-checked against the official htop project.
For broader context, continue with Trying Linux Without Installing: A Guide to Live USBs and How I Run Alpine-Based LXC Containers for Ultra-Lightweight Homelab Services.
Conclusion
htop is one of the best beginner-friendly Linux monitoring tools because it takes live system activity and makes it readable. The official project emphasizes the same things that make it valuable in practice: visible CPU and memory meters, scrollable process lists, full command lines, interactive filtering, sorting, and tree view, plus direct actions when you truly need them.
But the real improvement comes from how you use it. Read the system meters first. Use search and filter before visual guessing. Toggle tree view when the process list starts lying by omission. And use --readonly when your job is to inspect rather than intervene. Once you approach it that way, htop stops being a colorful screen and starts becoming a reliable first conversation with the machine.
FAQ
Is htop only useful when a system is already slow?
No. It is also useful for learning what “normal” looks like on your machine. The more familiar you become with usual CPU, memory, and process patterns, the easier it is to recognize when something genuinely changes.
When should I use tree view in htop?
Use tree view when a workload spawns child processes and the flat list stops making sense. It is especially helpful for browsers, build tools, containers, shells, and any service stack where parent-child relationships explain more than raw CPU percentages alone.